Transforming Flow Cytometry Data
This tutorial focuses on how to perform basic transformations to flow cytometry data using FlowCal, particularly by using the module FlowCal.transform
To start, navigate to the examples directory included with FlowCal, and open a python session therein. Then, import FlowCal as with any other python module.
>>> import FlowCal
Transforming to Arbitrary Fluorescence Units (a.u.)
Start by loading file sample006.fcs into an FCSData object called s.
>>> s = FlowCal.io.FCSData('FCFiles/sample006.fcs')
Let’s now visualize the contents of the FL1 channel. We will explore FlowCal’s plotting functions in the plotting tutorial, but for now let’s just use matplotlib’s hist function.
>>> import matplotlib.pyplot as plt
>>> plt.hist(s[:, 'FL1'], bins=100)
>>> plt.show()
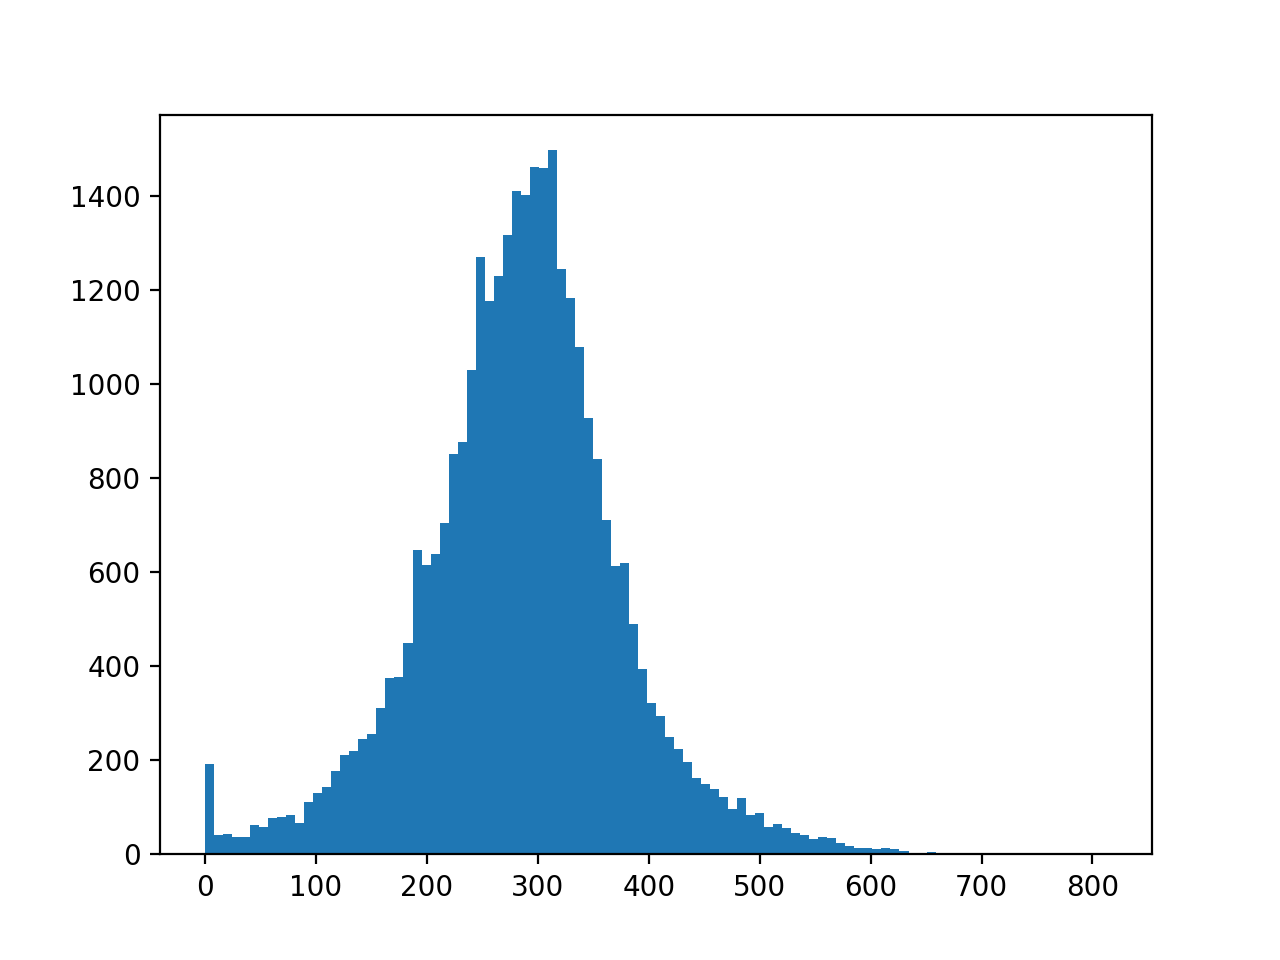
Note that the range of the x axis is from 0 to around 800. However, our acquisition software showed fluorescence values from 1 to 10000. Where does the difference come from? An FCS file normally stores raw numbers as they are are reported by the instrument sensors. These are referred to as “channel numbers”. The FCS file also contains enough information to transform these numbers back to proper fluorescence units, called Relative Fluorescence Intensities (RFI), or more commonly, arbitrary fluorescence units (a.u.). Depending on the instrument used, this conversion sometimes involves a simple scaling factor, but other times requires a non-straigthforward exponential transformation. The latter is our case.
Fortunately, FlowCal includes FlowCal.transform.to_rfi(), a function that reads all the necessary paremeters from the FCS file and figures out how to convert data back to a.u.
>>> s_transformed = FlowCal.transform.to_rfi(s, channels='FL1')
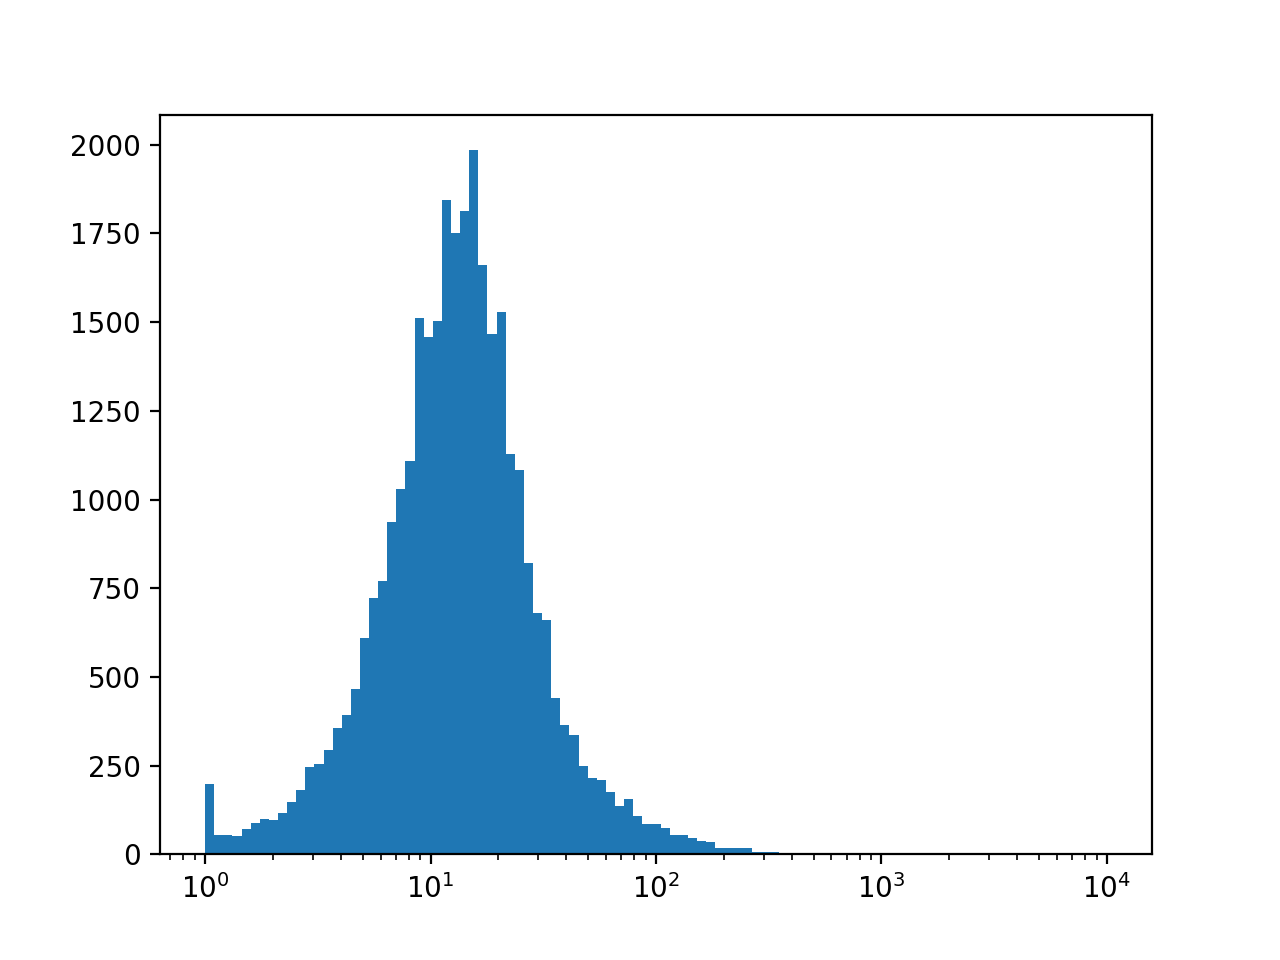
s_transformed now contains the same data as s, except that the FL1 channel has been transformed to a.u. Let’s now look at the transformed data.
>>> import numpy as np
>>> bins = np.logspace(0, 4, 100)
>>> plt.hist(s_transformed[:, 'FL1'], bins=bins)
>>> plt.xscale('log')
>>> plt.show()
We will explore a more convenient way to plot transformed data in the plotting tutorial.
FlowCal.transform.to_rfi() can transform several channels at the same time. In fact, all channels will be transformed if no channel is specified.
>>> s_transformed = FlowCal.transform.to_rfi(s)
We will use this throughout the whole tutorial right after loading an FCSData object.
Transforming to Molecules of Equivalent Fluorophore (MEF)
FlowCal includes the ability to transform flow cytometry data to Molecules of Equivalent Fluorophore (MEF), a unit independent of the acquisition settings. However, doing so is slightly more complex. We will see how to do this in the MEF tutorial.